
Duck-UI 2.0, open source
SQL on anything.Right in your browser.
A DuckDB workbench that lives in a tab. Open a file, write a query, chart the answer. Nothing to install, no account, and your data never leaves the machine.
SELECT country, count(*) AS stations,
       round(avg(geo_lat), 2) AS avg_lat
FROM 'https://blobs.duckdb.org/stations.parquet'
GROUP BY country
ORDER BY stations DESC| country | stations | avg_lat |
|---|---|---|
| NL | 397 | 52.16 |
| D | 105 | 51.11 |
| B | 48 | 51.05 |
| F | 14 | 46.18 |
| A | 10 | 47.94 |
| CH | 3 | 47.47 |
| GB | 1 | 51.53 |
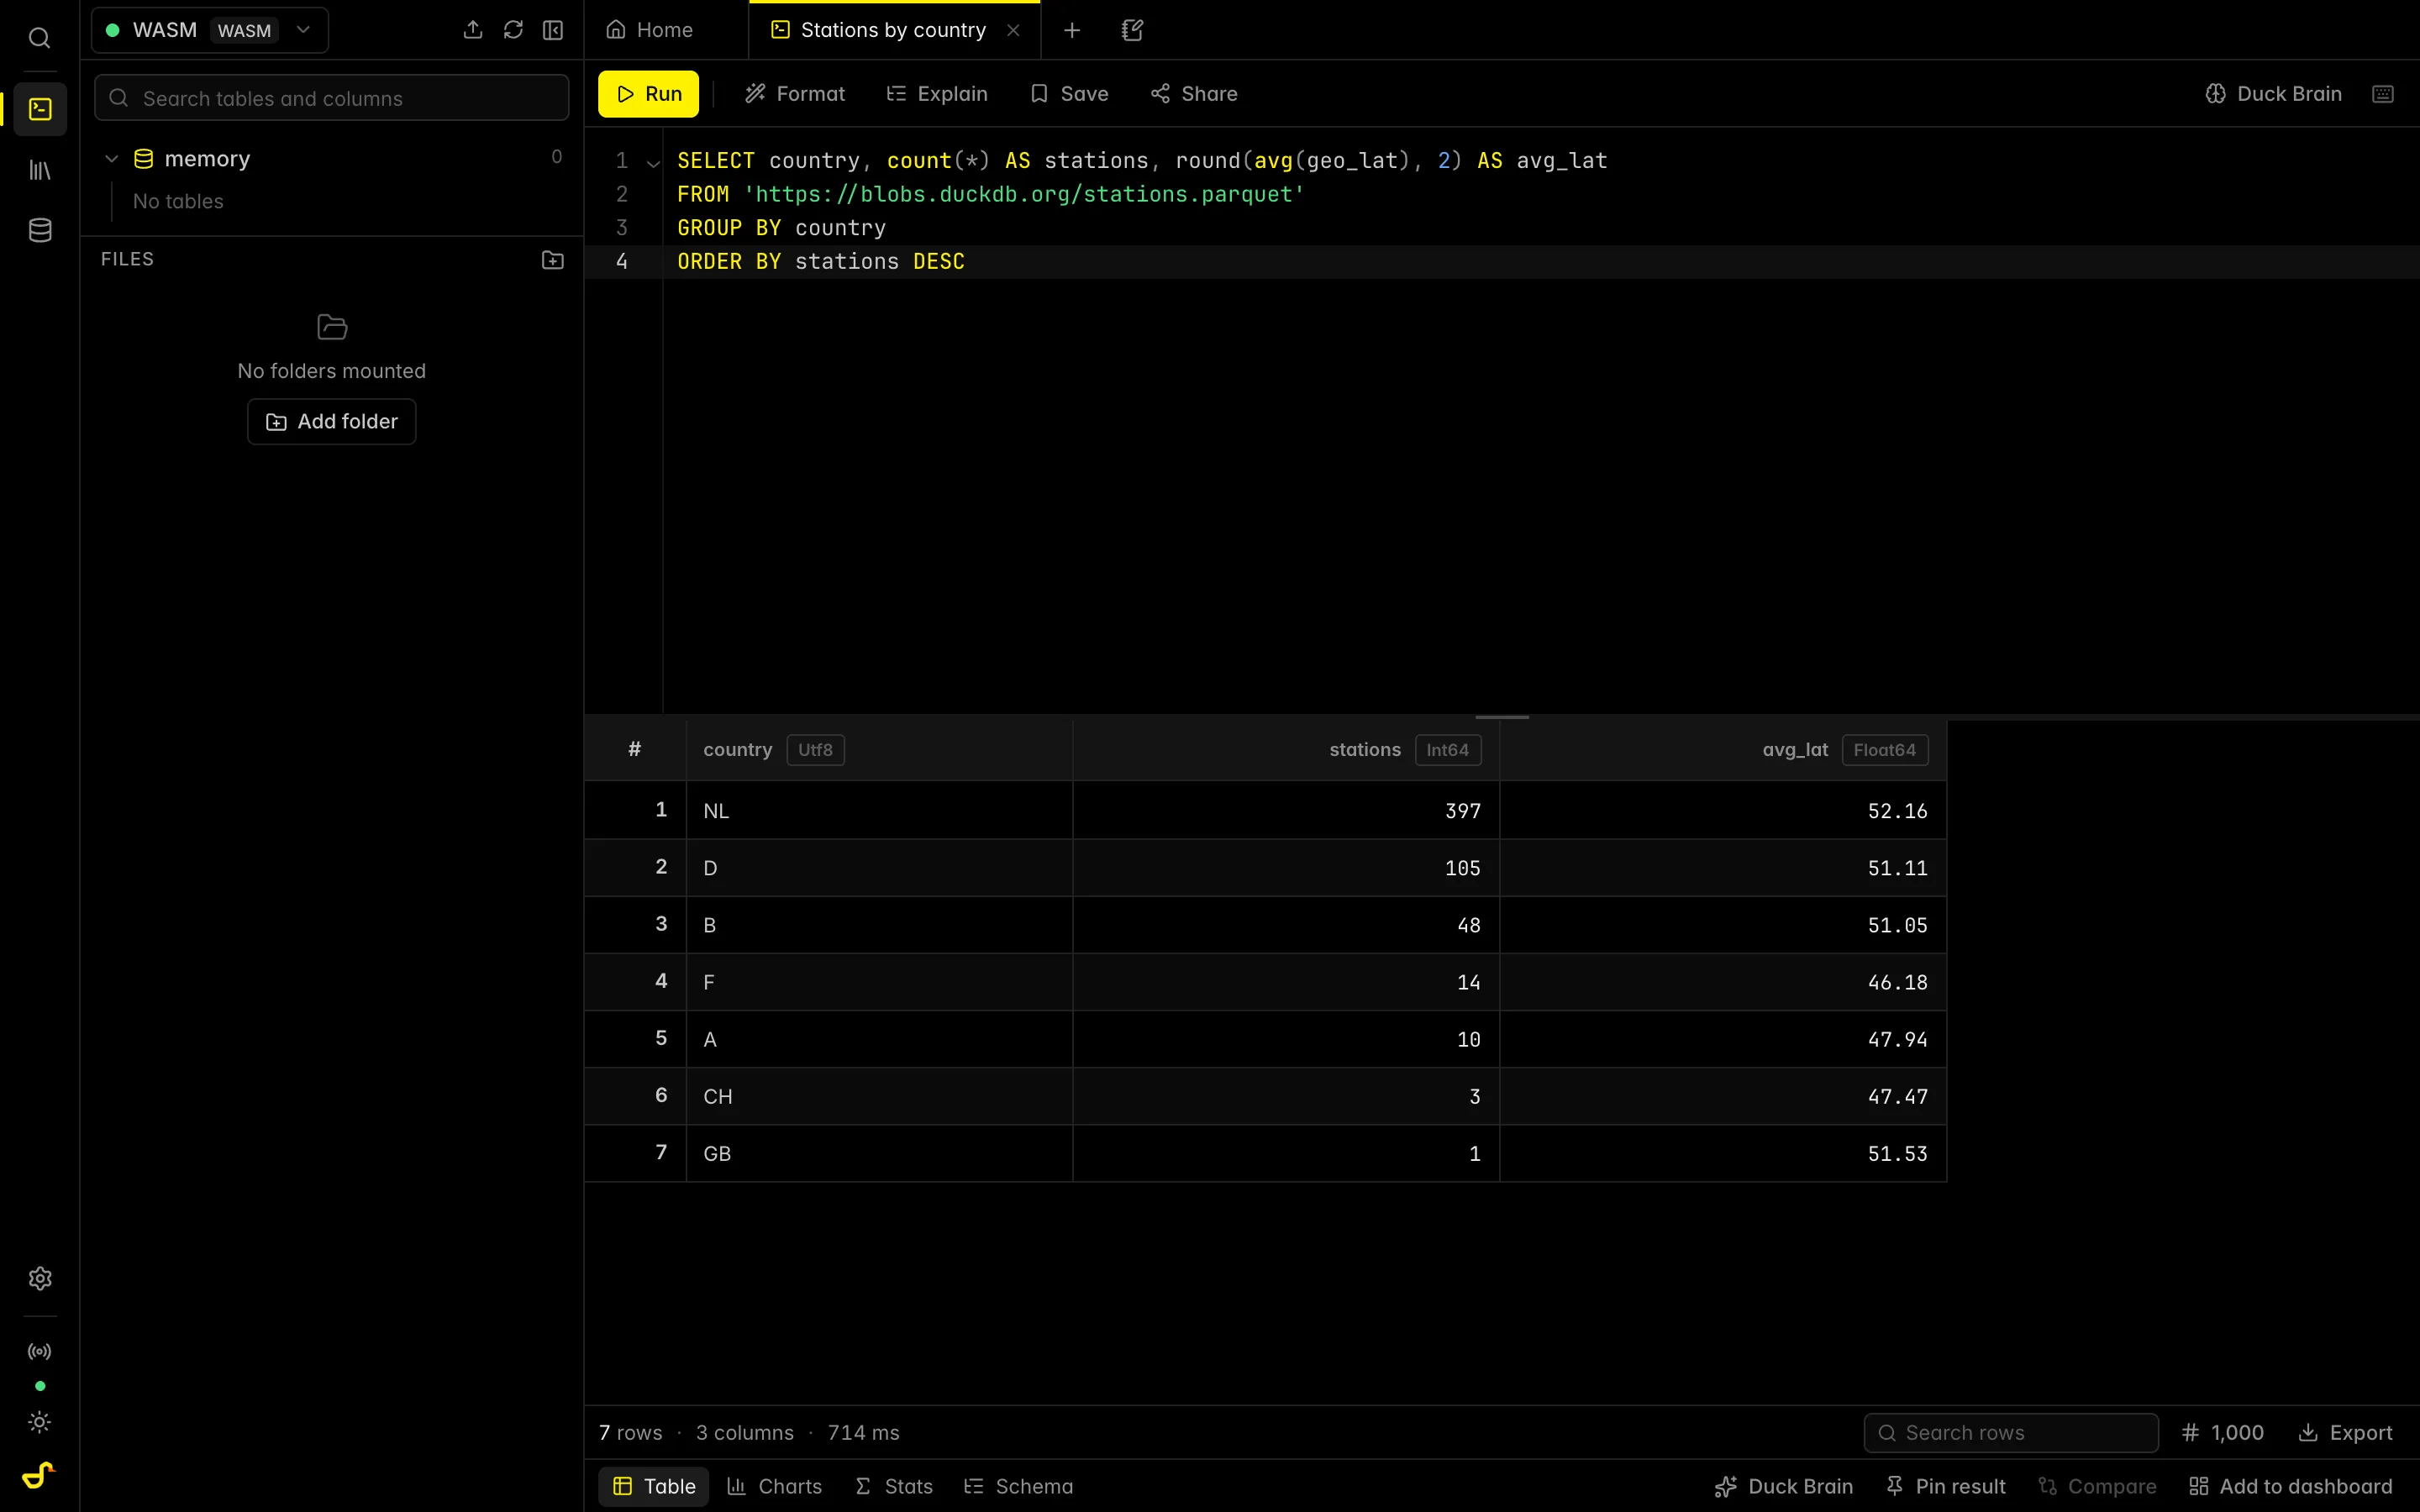
The workspace. DuckDB compiled to WebAssembly does the work; the interface starts at about 350 kB.
What's inside
A complete workbench, in one tab.
- Editor
- Completion from your own catalog, DuckDB-aware formatting, and ⌘Enter for the statement under the cursor. Errors are underlined where DuckDB points.
- Results
- A virtualized grid with sort, filter, column statistics, and exports to CSV, JSON, XLSX or Parquet.
- Notebooks
- SQL, Python and Markdown cells side by side. Python runs in Pyodide, and sql() hands you a pandas DataFrame.
- Dashboards
- Reports written as Markdown with live SQL inside. Inputs re-run only the queries that read them.
- Duck Brain
- Ask in plain language, get SQL. A model in the browser, or your own OpenAI, Anthropic or Ollama. Only the schema leaves the tab.
- Live sessions
- Bring someone into your workspace, browser to browser. Shared editors, visible cursors, no server in between.
- Your files
- CSV, JSON, Parquet, Arrow, Excel and DuckDB files, from disk, a URL, S3, R2 or a folder you mount once.
- Share
- An analysis travels as a link, or as a live chart in any page through one iframe. The data never goes with it.
Run it
Where you want it.
With Docker
One container, configured by environment variables.
docker run -p 5522:5522 ghcr.io/caioricciuti/duck-ui:latestFrom a link
Add ?load= and &sql= to the address and any public Parquet, CSV or JSON file opens as a runnable analysis.
Open a file. Ask it anything.
Free and MIT licensed, supported by QXIP and its sponsors.